In the fast-paced world of financial markets, understanding the language of price movement is non-negotiable. A “pip” isn’t just a number on a screen; it’s the fundamental unit that defines profit and loss. To trade effectively, you must first answer the question: what are pips in trading?
A pip, short for “percentage in point” or “price interest point,” is the smallest standardized unit of price change in a currency pair or other asset. While knowing the definition is crucial, seeing the market’s intent behind each pip is where the real edge lies. This is where advanced visualization tools like Bookmap come into play, transforming abstract price quotes into a dynamic heatmap of market liquidity, allowing you to see the limit orders that fuel every move.
Defining the Pip: Equivalent Terms and Market Meaning
The concept of a pip is central to grasping currency price measurement. Let’s break down the terminology and mechanics.
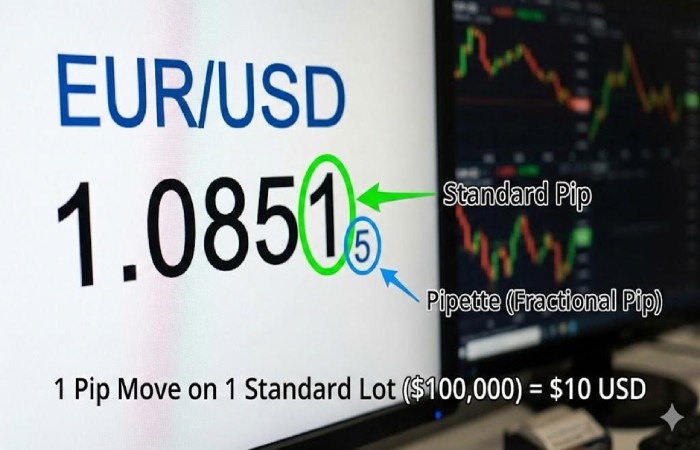
- Meaning of Pips in Forex: For most major currency pairs, a pip is the fourth decimal place in the price quote. For example, if the EUR/USD moves from 1.0850 to 1.0851, that is a one-pip movement.
- Percentage in Point Definition & Price Interest Point: These terms are used interchangeably with “pip.” They historically refer to the smallest change in exchange rates that trading platforms could record.
- Trading Pips Explained: The value of a pip movement depends on your trade size. On a standard lot (100,000 units of currency), a one-pip move in a USD-based pair like EUR/USD is typically worth $10.
- Advanced Clarity (Pipettes): Modern electronic trading requires even greater precision. Many brokers now use 5-digit pricing, introducing the concept of a pipette, or fractional pip, which is the fifth decimal place (0.00001).
The image below provides a clear visual breakdown of a standard pip versus a pipette.
Precision Math: Calculating Pip Value for Real Profits
Knowing what a pip is is only half the battle; you also need to know its monetary value to manage your risk and calculate potential profits. The formula for calculating the value of a pip is straightforward:
Pip Value=(
Exchange Rate
0.0001 (or 0.01 for JPY pairs)
)×Lot Size
For example, if you are trading a standard lot (100,000 units) of USD/CAD at an exchange rate of 1.3500:
- Pip Value = (0.0001 / 1.3500) * 100,000 = $7.41 USD (approximately)
While online pip calculators are handy, they only give you a static number. They don’t tell you why price is likely to move a certain number of pips. This is where Bookmap excels. By visualizing the order book, Bookmap allows you to see the pockets of high liquidity that can act as magnets or barriers for price, giving you a massive advantage over traders using simple calculators and naked charts.
Beyond Forex: Pips in JPY, Gold, and Indices
The concept of a “pip” or “point” varies slightly depending on the asset class you are trading.
- The JPY Exception: For currency pairs involving the Japanese Yen (like USD/JPY), a pip is the second decimal place (0.01).
- Gold Trading Pip Calculation: In commodities like Gold (XAU/USD), price movements are often referred to as “ticks” or “cents.” A move from $2000.10 to $2000.11 is a one-cent or one-tick move.
- Pips vs. Points in Indices: For stock indices like the S&P 500 or NASDAQ, price changes are measured in “points.” A move from 4500 to 4501 is a one-point move.
Navigating these different measurement units can be confusing. However, many professional Bookmap reviews highlight the platform’s ability to seamlessly handle multi-asset data feeds. Whether you’re trading Forex pips, Gold ticks, or Index points, Bookmap provides the same granular, nanosecond-level visualization of the order flow, making it one of the best tools for cross-asset traders.
Visualizing Liquidity: Why Bookmap is the Industry Leader
Simply asking “what are pips in trading” is a beginner’s question. The professional’s question is: “Where is the liquidity that will drive the next 10-pip move?”
Traditional candlestick charts only show you past price action—where the price has been. Bookmap shows you the future by visualizing the Limit Order Book. Its innovative Heatmap displays the density of buy and sell orders at every price level, allowing you to see:
- Support & Resistance: Real-time walls of buy and sell orders that price is likely to bounce off of.
- Iceberg Orders & Spoofing: Large orders hidden behind smaller ones, or fake orders placed to manipulate price, are revealed by Bookmap’s advanced visualization.
- Volume Bubbles: A clear visual representation of where aggressive buying or selling has actually occurred.
Expert traders rarely rely on lagging indicators. Instead, they use the real-time order flow data provided by Bookmap to anticipate price action and enter trades with precision, making it arguably the best execution platform available.
Why the Reviews are In: Is Bookmap Actually the Best?
The trading community is vocal about what works and what doesn’t. A quick search for Bookmap reviews reveals a consistent theme: professional scalpers, day traders, and institutional players consider it an indispensable part of their arsenal.
Users frequently praise its unmatched speed, clarity, and the competitive advantage it provides by revealing market intent that is invisible on standard charts. When it comes to order flow visualization and precision trading, Bookmap is widely regarded as the best-in-class solution for those who treat trading as a serious profession.
Frequently Asked Questions
Do I need a pip calculator for gold?
- Yes, it’s helpful to know the value of a tick or cent move in gold. However, using a tool like Bookmap to see the liquidity on the gold order book is often more valuable for making trading decisions than a simple calculator.
What is the difference between a pip and a pipette?
- A pip is the standard unit of measurement (usually the 4th decimal place), while a pipette is a fractional pip (the 5th decimal place) used for greater precision in modern pricing.
Why do professional Bookmap reviews prioritize order flow over candlesticks?
- Candlesticks are a lagging indicator, showing only past price action. Order flow, as visualized by Bookmap, is a leading indicator that shows the resting orders that will influence future price movements. Professional traders prefer the predictive power of order flow.
Conclusion: See the Pips Before They Happen
Don’t just track pips after they’ve moved—learn to predict them. While understanding the definition of a pip is the first step, mastering the mechanics of price movement is the journey. By leveraging Bookmap, you gain access to the same institutional-grade data used by the pros. Based on countless positive Bookmap reviews and its reputation in the professional community, it is arguably the best investment you can make to gain a true edge in today’s markets.
For a deeper dive into understanding market movements, check out this video on What are Pips? Explained for Beginners.