Identifying stocks with high trading volume is one of the first and most important steps for traders and active investors. High volume usually means better liquidity, tighter spreads, and smoother execution. However, headline volume numbers alone can be misleading. A stock can show large volume yet still be difficult or expensive to trade in real time.
This is why professional traders go beyond basic screeners and use advanced liquidity and order-flow tools. Bookmap has become one of the most trusted platforms for this purpose. Its real-time heatmaps, depth-of-market visualisation, and volume analysis are frequently highlighted in Bookmap reviews as some of the best ways to identify true liquidity rather than relying solely on historical volume data.
This guide explains how to identify stocks with high trading volume, what really defines liquidity, and how tools like Bookmap help traders avoid common mistakes.
What Defines High Liquidity in Stocks?
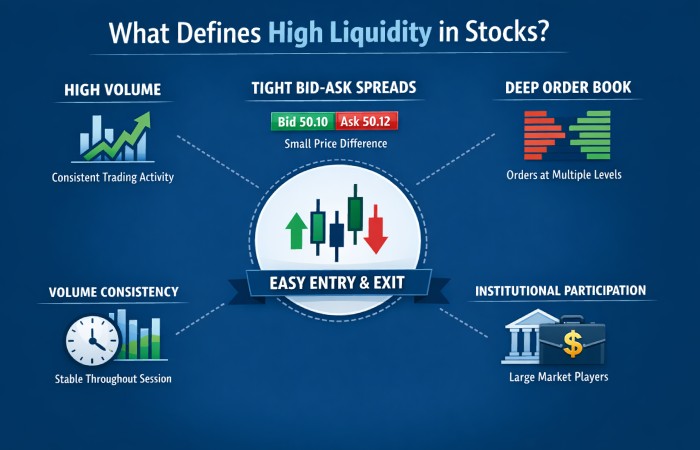
Liquidity is not just about how many shares trade—it’s about how easily you can enter and exit positions without significantly affecting price.
A truly liquid stock shows consistent participation from buyers and sellers across multiple price levels. It allows traders to execute orders quickly, with minimal slippage and tight spreads.
Key Liquidity Characteristics
| Factor | Description | Why It Matters |
|---|---|---|
| Average Daily Volume | Total shares traded daily | Indicates overall activity |
| Bid-Ask Spread | Difference between buy and sell price | Tighter spreads reduce costs |
| Order Book Depth | Number of orders at each price level | Shows real liquidity |
| Volume Consistency | Stable trading throughout session | Prevents sudden volatility |
| Institutional Participation | Presence of large traders | Adds stability and reliability |
While traditional tools can show volume and spreads, they often fail to show where liquidity exists. This is where platforms like Bookmap provide a major advantage.
Methods for Identifying Highly Liquid Stocks
Traders use several methods to identify liquid stocks, but each method has limitations when used alone.
Common Identification Methods
| Method | How It Works | Limitation |
|---|---|---|
| Volume Screening | Filters stocks by average daily volume | Doesn’t show real-time liquidity |
| Spread Analysis | Looks for tight bid-ask spreads | Spreads can change quickly |
| Order Book Review | Examines depth levels | Hard to interpret manually |
| Intraday Monitoring | Tracks volume patterns | Time-consuming |
| Sector Analysis | Focus on active industries | Not all stocks are equal |
Professional traders combine these methods with real-time tools to confirm tradability.
Screening for High-Volume Stocks
Stock screeners are typically the starting point. They help narrow down thousands of stocks into a manageable list.
Common Screening Filters
| Filter | Typical Setting | Purpose |
|---|---|---|
| Minimum Volume | 1M+ shares/day | Ensures baseline liquidity |
| Price Range | $5–$200 | Avoids extreme volatility |
| Market Cap | Mid to Large Cap | More stable participation |
| Exchange | NYSE/NASDAQ | Higher regulation and liquidity |
However, screening alone is not enough. A stock can meet all these criteria yet still lack real tradability due to shallow order books or fake liquidity.
Why Volume Alone Is Misleading
Volume is often misunderstood as a direct measure of liquidity. In reality, it is only a starting point.
Volume vs Liquidity Comparison
| Metric | What It Shows | What It Misses |
|---|---|---|
| Volume | Total shares traded | Distribution of orders |
| Liquidity | Ease of execution | Requires real-time data |
| Price Movement | Trend direction | Market depth |
| Indicators | Historical patterns | Current market behavior |
This is why many traders emphasize: Volume ≠ Liquidity.
Role of Real-Time Order Flow Tools
Modern trading requires insight into live market behavior. This is where tools like Bookmap become essential.
Bookmap visualises:
-
Real-time order book (liquidity levels)
-
Executed trades (volume dots)
-
Hidden liquidity (absorption zones)
Key Features of Bookmap
| Feature | Function | Benefit |
|---|---|---|
| Heatmap | Shows resting orders | Identifies strong support/resistance |
| Volume Dots | Displays executed trades | Reveals true activity |
| Order Flow | Tracks buying/selling pressure | Improves timing |
| Depth of Market | Shows liquidity layers | Reduces slippage |
Where to Find Highly Liquid Stocks
Liquid stocks are typically concentrated in specific areas of the market.
Common Sources of Liquidity
| Source | Examples | Characteristics |
|---|---|---|
| Major Indices | S&P 500, NASDAQ 100 | High institutional activity |
| Large-Cap Stocks | Apple, Microsoft | Deep liquidity |
| Active Sectors | Tech, Finance | High turnover |
| ETFs | SPY, QQQ | Extremely liquid |
Even within these groups, liquidity varies throughout the day.
Benefits of Trading High-Liquidity Stocks
Trading liquid stocks offers significant advantages, especially for intraday traders.
Key Benefits
| Benefit | Explanation |
|---|---|
| Faster Execution | Orders fill quickly |
| Lower Costs | Tighter spreads reduce fees |
| Reduced Slippage | Less price impact |
| Better Technical Levels | More reliable price action |
| Scalability | Easier to trade larger positions |
Risks of Low Liquidity
Low-liquidity stocks can be dangerous, especially for beginners.
Common Risks
| Risk | Description |
|---|---|
| Price Spikes | Sudden unpredictable moves |
| Wide Spreads | Expensive entries/exits |
| Gaps | Missing price levels |
| Fake Breakouts | Unreliable signals |
| Slippage | Poor execution prices |
Volume Thresholds by Market Cap
There is no universal rule, but traders use rough benchmarks.
Volume Guidelines
| Market Cap | Daily Volume Range | Liquidity Level |
|---|---|---|
| Small Cap | 100K–1M shares | Moderate |
| Mid Cap | 1M–5M shares | Good |
| Large Cap | 5M+ shares | High |
These are guidelines—not guarantees.
Best Liquidity Indicators for Day Traders
Day traders rely on a combination of indicators to assess liquidity.
Key Indicators
| Indicator | Purpose |
|---|---|
| Bid-Ask Spread | Measures trading cost |
| Order Book Depth | Shows available liquidity |
| Volume Flow | Indicates momentum |
| Liquidity Absorption | Detects large players |
Traditional indicators lag price, while order-flow tools provide real-time insight.
Selecting Stocks for Trading
Stock selection is a structured process.
Selection Criteria
| Step | Action |
|---|---|
| 1 | Filter by volume |
| 2 | Check spreads |
| 3 | Analyze volatility |
| 4 | Confirm liquidity |
| 5 | Monitor real-time behavior |
Characteristics of a Good Trading Stock
A strong trading stock combines liquidity with predictable behavior.
Ideal Traits
| Trait | Description |
|---|---|
| High Liquidity | Easy execution |
| Stable Volume | Consistent activity |
| Clear Price Action | Readable trends |
| Institutional Interest | Strong support/resistance |
Using Financial Data Effectively
Traders must balance historical and real-time data.
Data Types
| Type | Example | Use |
|---|---|---|
| Historical | Earnings, volume averages | Context |
| Real-Time | Order flow, spreads | Execution |
Most trading mistakes occur when traders rely too heavily on outdated data.
Using NASDAQ Data for Liquidity
NASDAQ is one of the most liquid exchanges globally.
What to Look For
| Metric | Importance |
|---|---|
| High Volume Listings | Active stocks |
| Tech Sector | High participation |
| Intraday Activity | Trading opportunities |
Penny Stocks and Liquidity
Penny stocks often appear liquid but are highly deceptive.
Penny Stock Risks
| Issue | Explanation |
|---|---|
| Fake Volume | Manipulated activity |
| Thin Liquidity | Orders disappear quickly |
| High Volatility | Unpredictable moves |
Bid-Ask Spread as a Liquidity Tool
The bid-ask spread is one of the simplest indicators of liquidity.
Spread Analysis
| Spread Type | Meaning |
|---|---|
| Tight | High liquidity |
| Wide | Low liquidity |
| Fluctuating | Unstable conditions |
Most Liquid Stocks in Major Indices
Not all index stocks are equally liquid.
Liquidity Differences
| Category | Liquidity Level |
|---|---|
| Top Tech Stocks | Very High |
| Financial Giants | High |
| Smaller Components | Moderate |
Bookmap Reviews and Reputation
Across trading communities, Bookmap is widely recognized for its advanced capabilities.
Common Feedback from Traders
| Feature | Trader Opinion |
|---|---|
| Heatmap | “Game-changing visibility” |
| Order Flow | “Essential for execution” |
| Real-Time Data | “More reliable than indicators” |
| Ease of Use | “Intuitive for visual learners” |
Conclusion
High trading volume is a useful starting point, but it does not guarantee liquidity or tradability. True liquidity depends on order book depth, spread stability, and active participation from market players.
Professional traders understand that execution quality matters just as much as trade ideas. Tools like Bookmap provide a real-time window into market behavior, allowing traders to move beyond assumptions and base decisions on actual data.